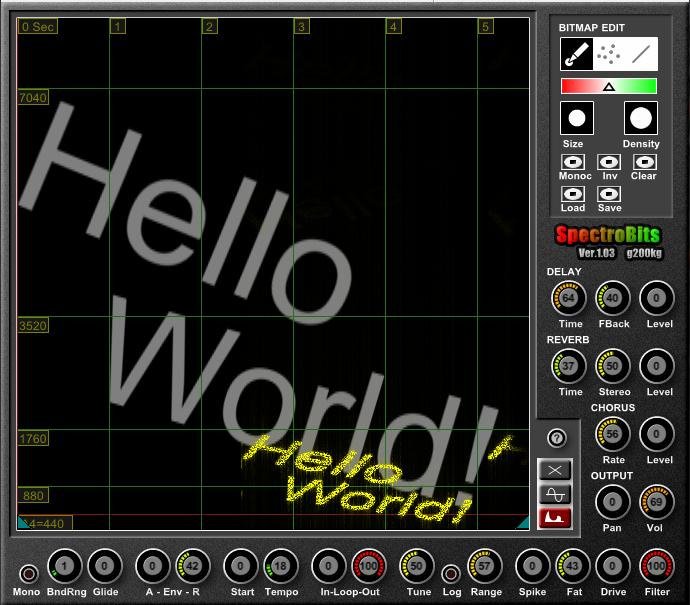
SpectroBits size 2.08 MB SpectroBits interprete the image as a “Spectrogram“, that means X-Axis as time, Y-Axis is frequency (but the MIDI note determine the base-note). The black pixel is silent. The bright pixels means strong harmonics for that freq. ...
Ads Blocker Detected!!!
We have detected that you are using extensions to block ads. Please support us by disabling these ads blocker.
