SpectroBits v1.0

SpectroBits
size 2.08 MB
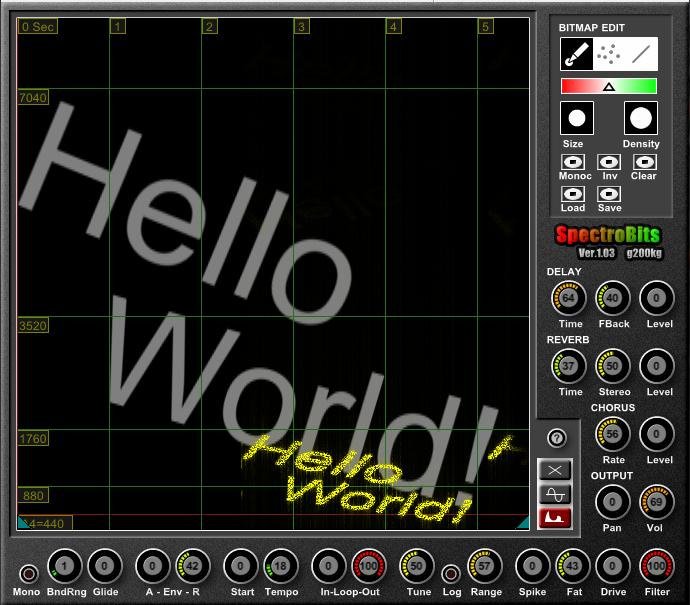
SpectroBits interprete the image as a “Spectrogram“, that means X-Axis as time, Y-Axis is frequency (but the MIDI note determine the base-note).
The black pixel is silent. The bright pixels means strong harmonics for that freq.
The “A4=440” (red) line means 440Hz if you play the note ‘A4’.
“880” line is 880Hz if you play the note ‘A4’, and so on…
About colors, Red for L-ch and Green for R-ch. Blue is ignored.
The image can be edit by right upper “BITMAP EDIT” section. You can also import any images of “.bmp”, “.png”, “.jpg” and “.gif”. Image size is fixed to 512×512. Any images are resized automaticaly to 512×512 if you import.


spectrobits103 ( 2.08 MB )

We’re audio producers and sound designers with over 20 years of experience in the industry. Our team has lived through the entire evolution of digital audio production.
Our mission? To filter out the junk and bring you only the studio-ready free VSTs that actually compete with paid gear. We do the digging so you can focus on creating.
Recent Posts
Magical FDS Plug – 8-Bit Synth VST
I've been digging through the web and found something special for your arsenal today. If you've ever tried to produce…
Trasher Lite – Free Waveshaper
Ever feel like your 808s or synth leads are sounding flat, but the moment you throw a standard saturation plugin…
KickSpace – Transient Pan Modulator
Tired of your kicks getting absolutely swallowed by wide snares and massive synth stacks? Every producer knows the struggle. You…
Apus – Free Lo-Fi VST
I've been digging through the web and found something special for your arsenal. We’ve all been there: you’re trying to…
DuckTool – Sidechain Ducking VST
Tired of your kick and bass fighting for their lives in the low-end, destroying your headroom? We've all been there…
MechanOdd – Modeling Synth
What's good fam! Let's be real for a second - are you tired of loading up the same plastic-sounding digital…