SpectroBits v1.0

SpectroBits
size 2.08 MB
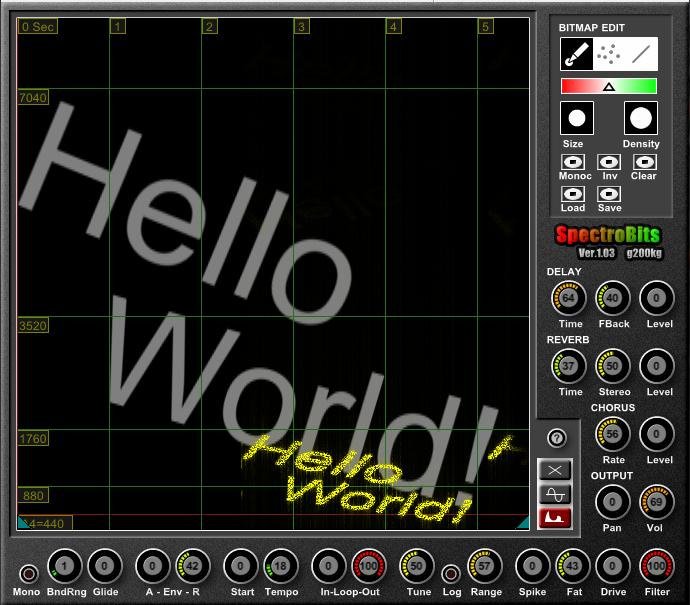
SpectroBits interprete the image as a “Spectrogram“, that means X-Axis as time, Y-Axis is frequency (but the MIDI note determine the base-note).
The black pixel is silent. The bright pixels means strong harmonics for that freq.
The “A4=440” (red) line means 440Hz if you play the note ‘A4’.
“880” line is 880Hz if you play the note ‘A4’, and so on…
About colors, Red for L-ch and Green for R-ch. Blue is ignored.
The image can be edit by right upper “BITMAP EDIT” section. You can also import any images of “.bmp”, “.png”, “.jpg” and “.gif”. Image size is fixed to 512×512. Any images are resized automaticaly to 512×512 if you import.


spectrobits103 ( 2.08 MB )

We’re audio producers and sound designers with over 20 years of experience in the industry. Our team has lived through the entire evolution of digital audio production.
Our mission? To filter out the junk and bring you only the studio-ready free VSTs that actually compete with paid gear. We do the digging so you can focus on creating.
Recent Posts
DearVR Mix-SE – Virtual Mix Room
Tired of your mixes sounding fire in your headphones but completely falling apart the second you play them in the…
Waveform Compressor – Visual Comp
Are your mixes sounding lifeless because you're over-compressing blind? I found a fix. We’ve all been there—squashing the life out…
YS Compressor 2025 – Mixing Comp
Are your mixes sounding thin and sterile? I found a fix. You know the struggle - you’re trying to get…
Spl4sh 4 – Free Synth VST
Are your Future House leads sounding a little thin and lifeless? I found a fix. As a producer, one of…
VoxRelief Lite – Vocal Fixer
Tired of muddy, boxy vocals ruining your mix? I found a fix. We’ve all been there in the studio: you…
HLF-3C – Passive EQ Filter
Tired of your instrument busses sounding like a muddy, cluttered mess? I found a fix. There is nothing worse than…